Does being Swiss make you more likely to recycle in Lausanne?
An interactive data visualization of the recycling habits of the city of Lausanne, Switzerland.
How does waste management vary across districts when comparing origin, the amount of waste produced, and efficiency in 2023?
The data visualization has been developed using the D3.js framework, a powerful JavaScript library designed for creating dynamic and interactive data-driven graphics.
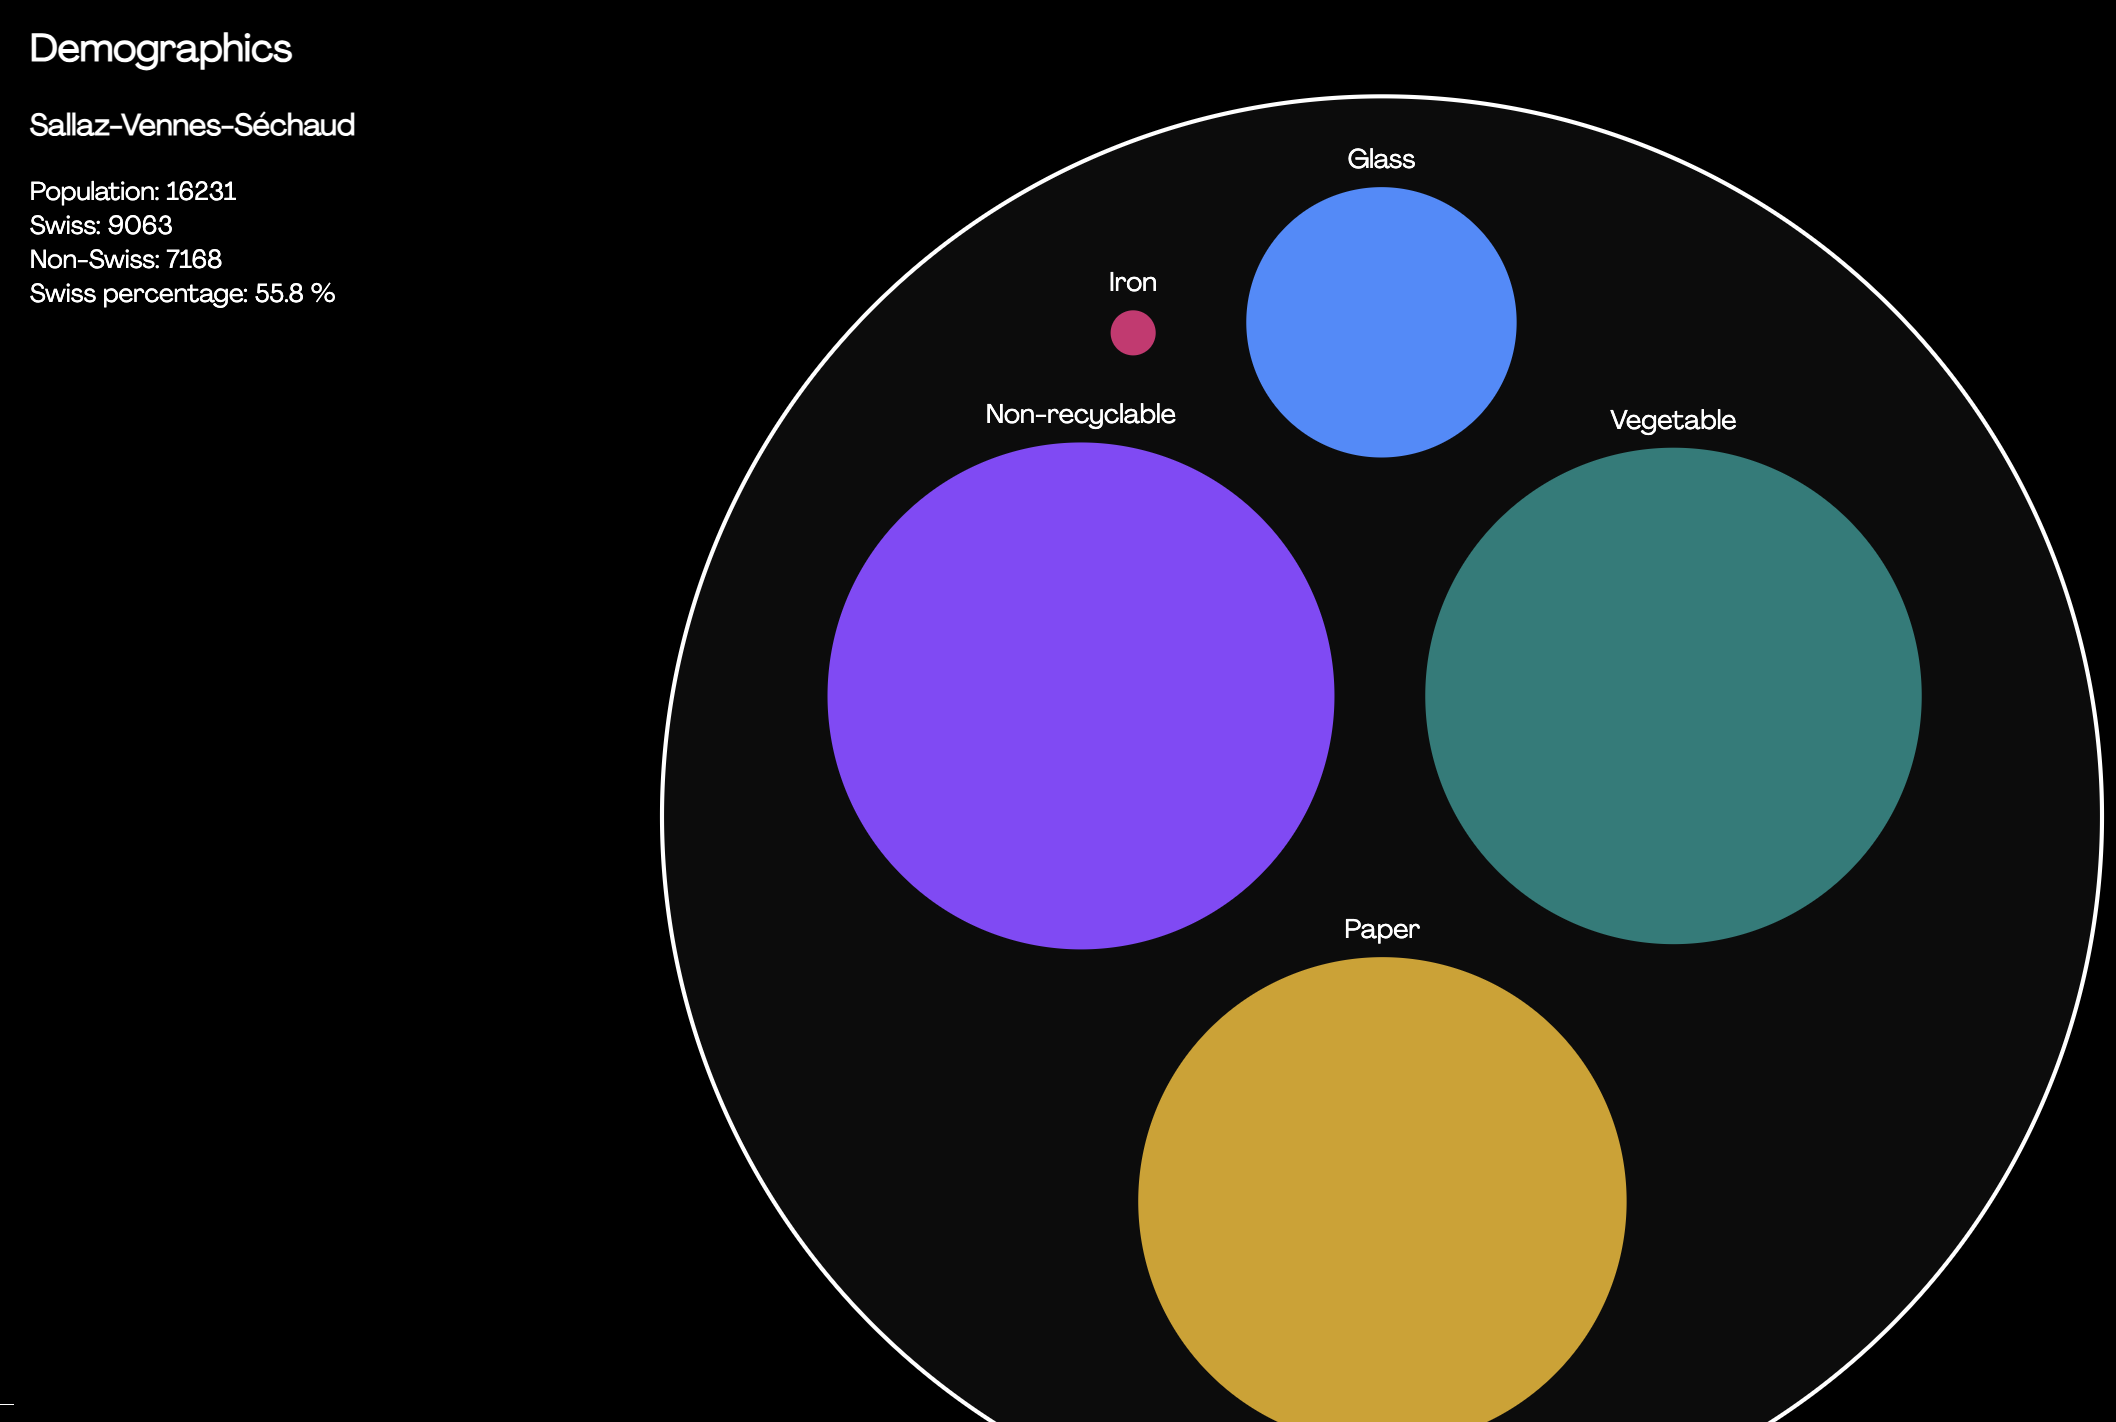
In this implementation, D3.js is utilized to generate a circle-packing layout, dynamically scaling and positioning elements based on hierarchical data. The visualization not only renders nested circles to represent districts and waste categories but also integrates animated transitions, scalable labels, and interactive zooming, allowing users to explore the dataset intuitively. Additionally, custom styling, opacity scaling, and event-driven interactions enhance readability and engagement, making the data both insightful and visually compelling.
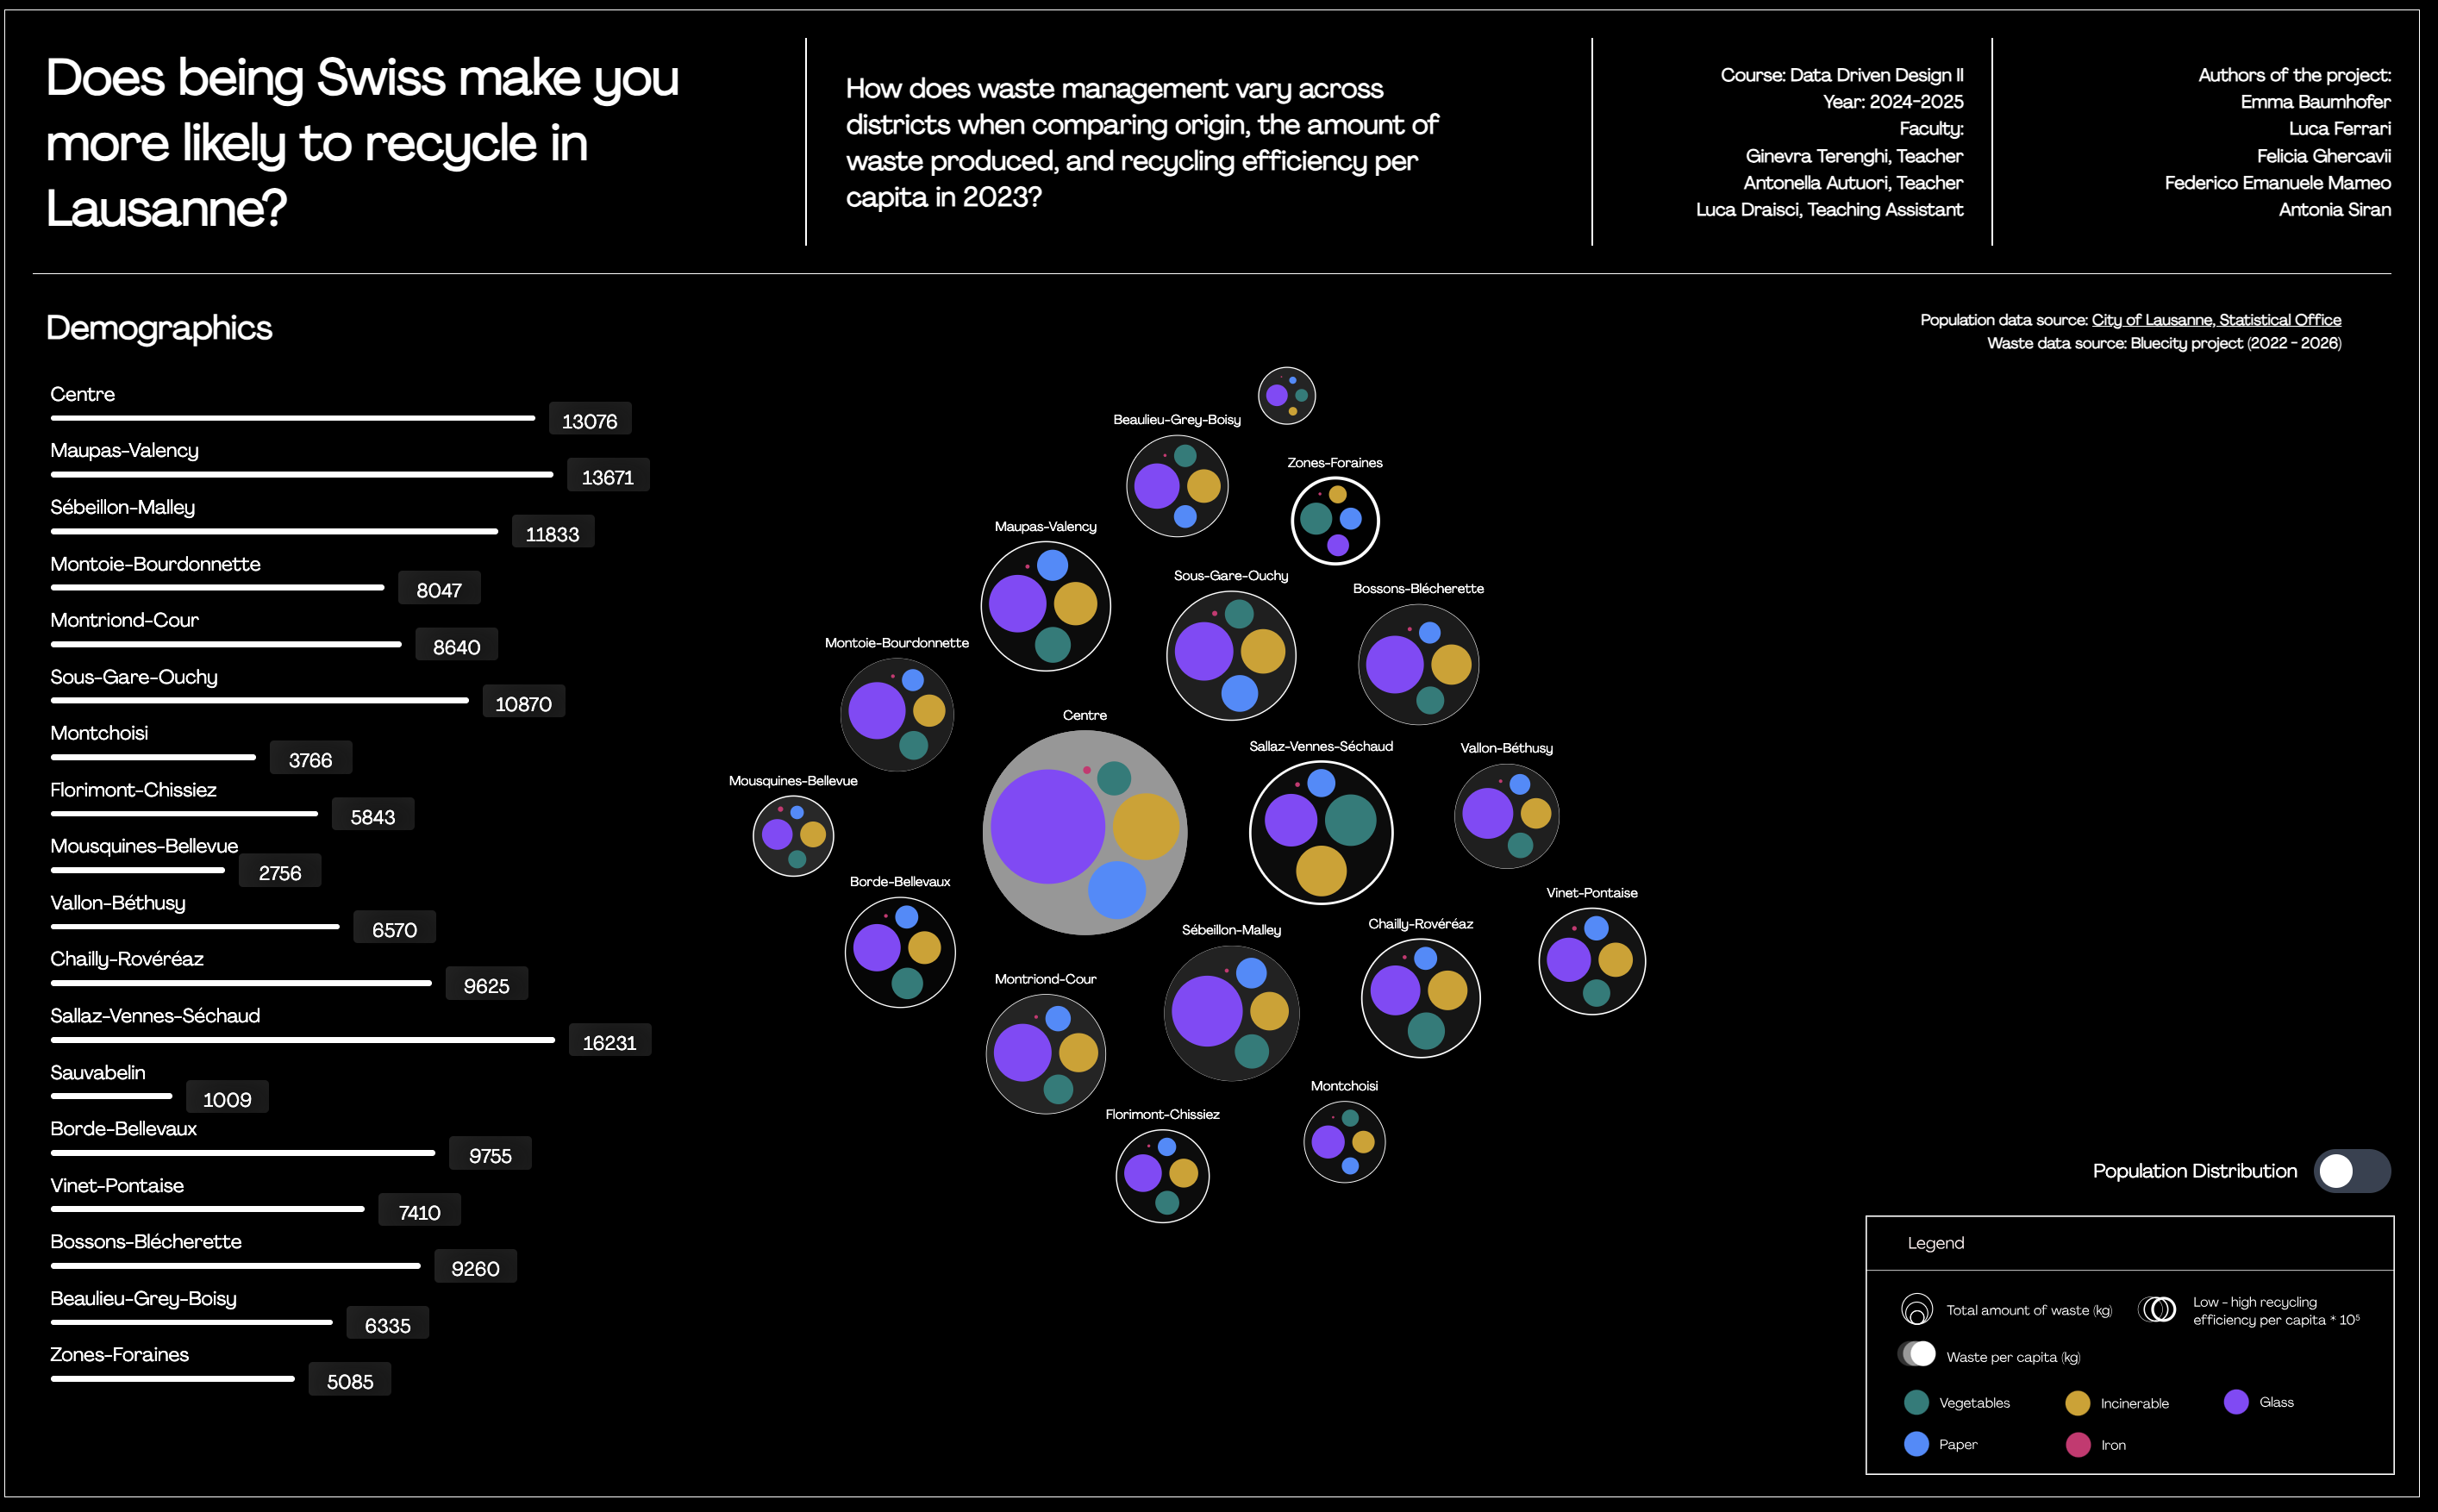
Key Findings
- While it's true that the areas with the most non-Swiss have the worst results, the areas with the most Swiss are also not the clear leaders.
- From this, we conclude that it would probably improve waste production and efficiency in Lausanne if the municipality engaged differently with non-Swiss residents.
- At the same time, the districts with the best results are pretty evenly split between Swiss and non-Swiss (~55% Swiss), which indicates that other factors than origin are probably more relevant to these metrics.
- Other factors could be age, access to infrastructure, or neighbourhood culture, and these would need to be further explored in further research.
- Comparing age against these results would be an interesting next demographic area to investigate. This could affect how we interpret the poor results for the non-Swiss districts if we find that our key metrics are most influenced by age, than origin of the population.
Learning: By focusing on certain aspects of the data, it's easy to lead the viewer to understand one story about the data that might not capture the full pic.